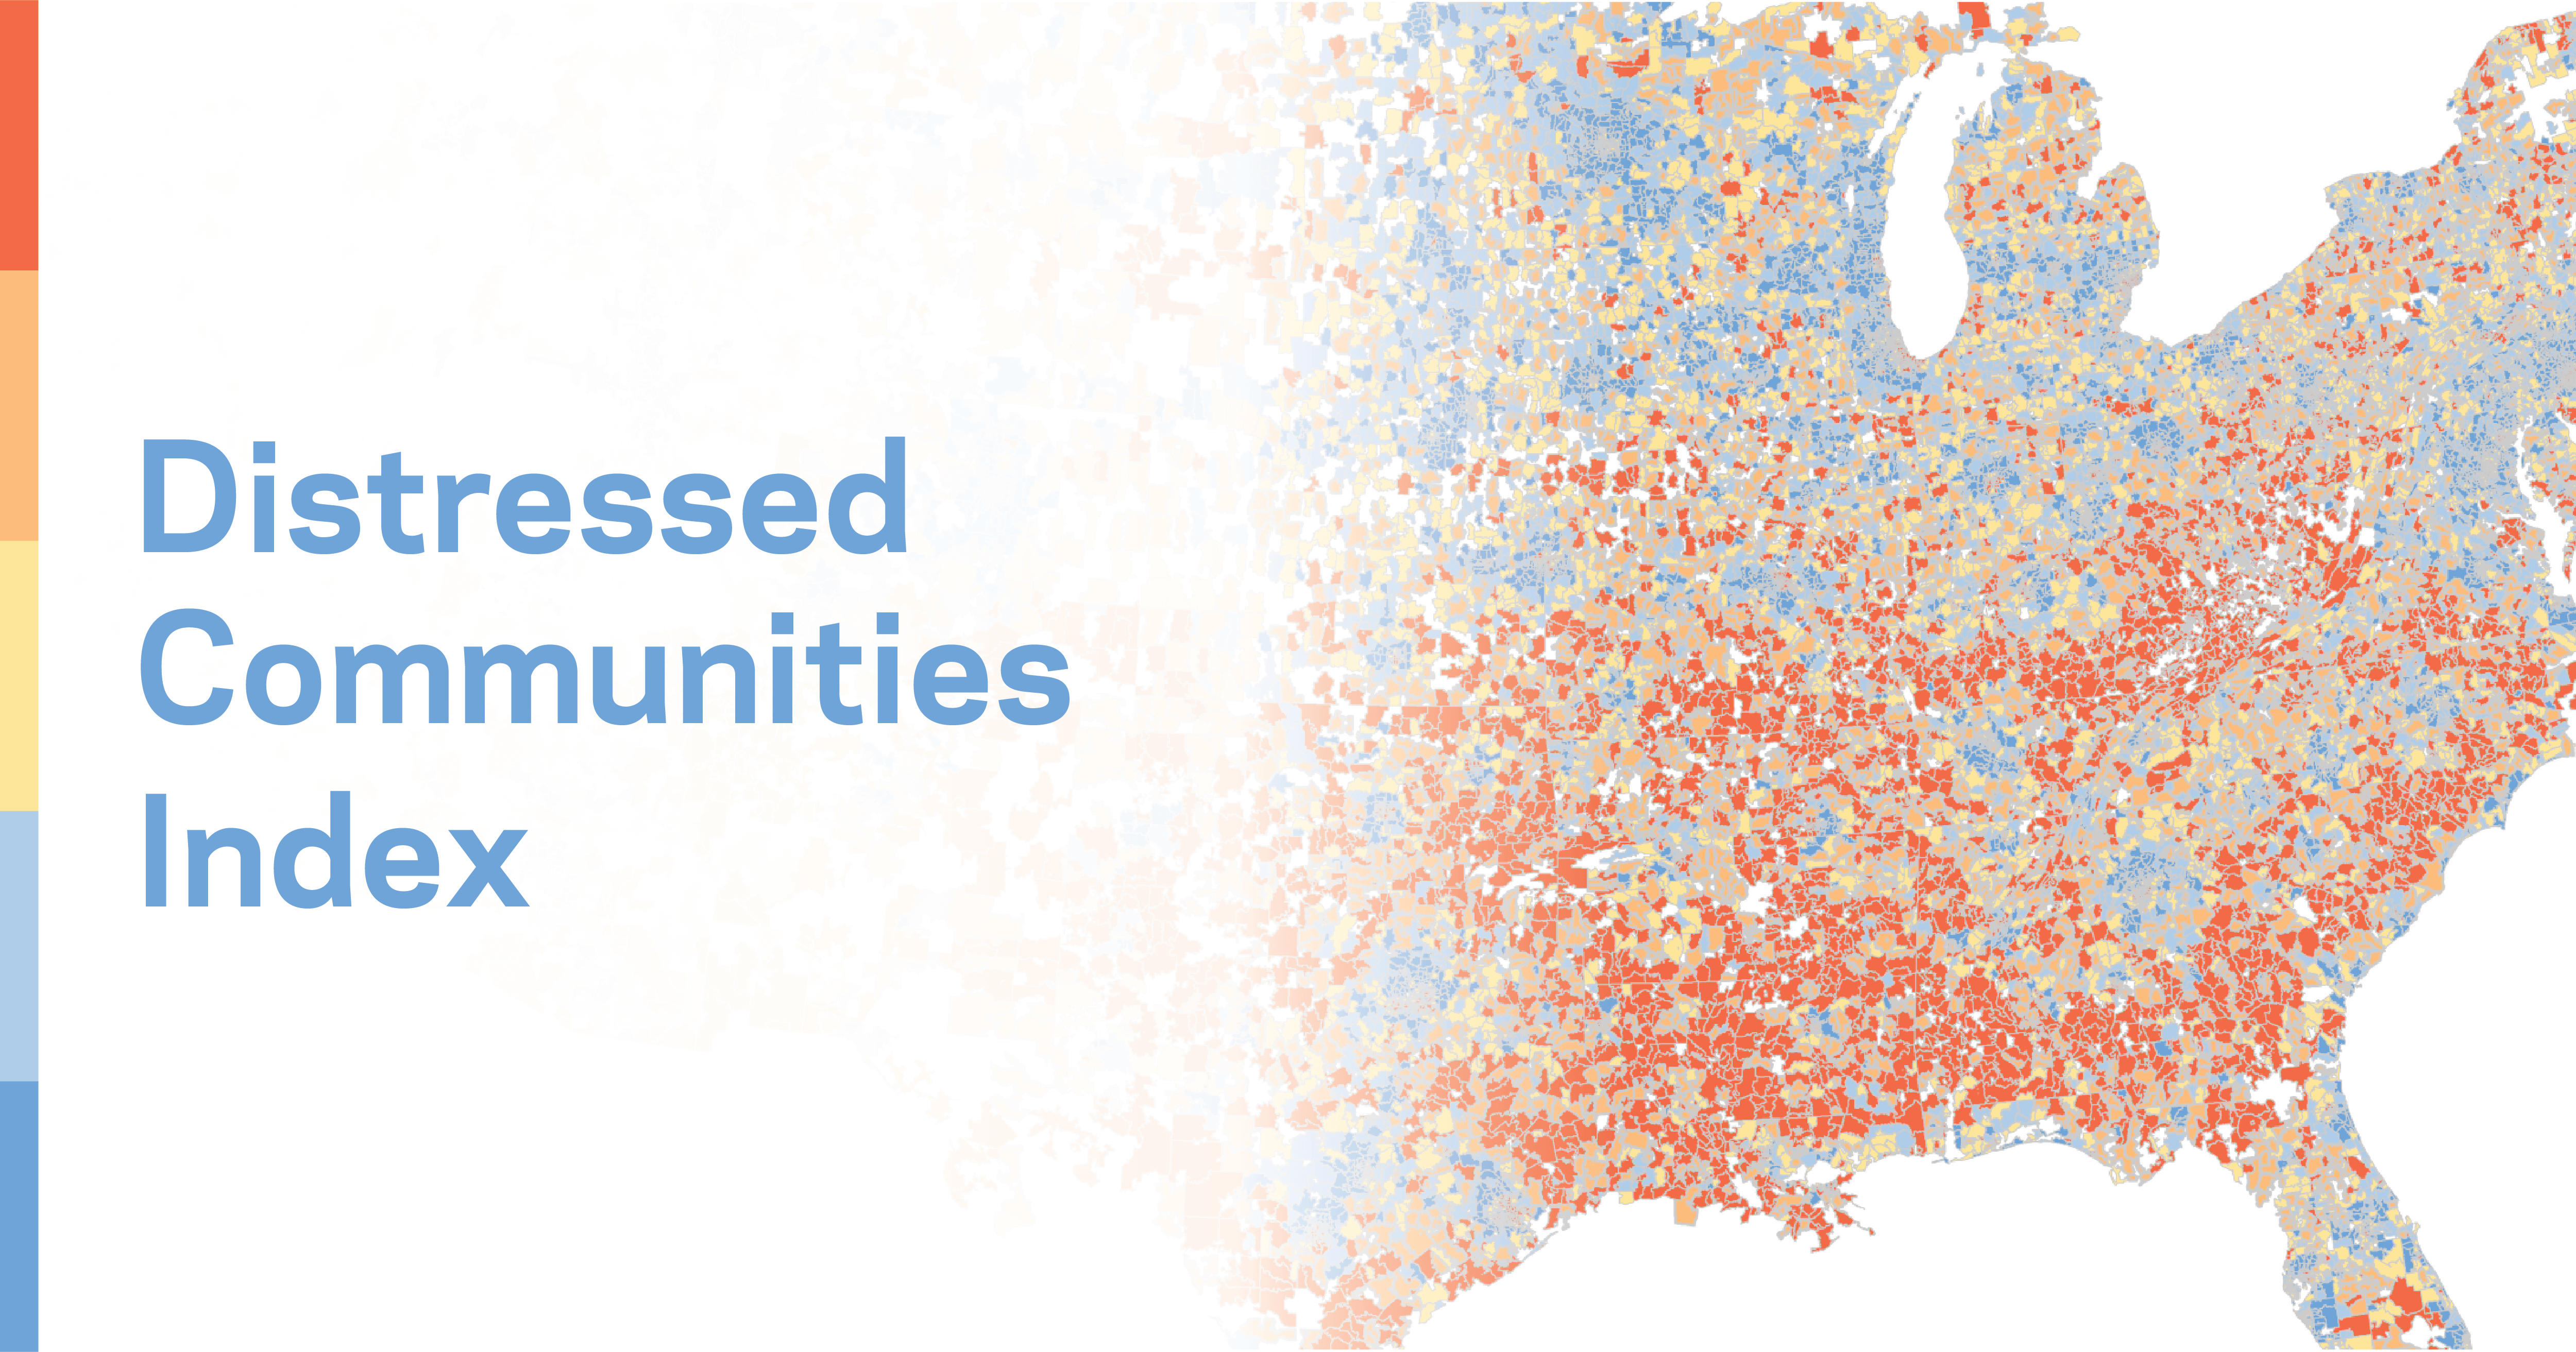

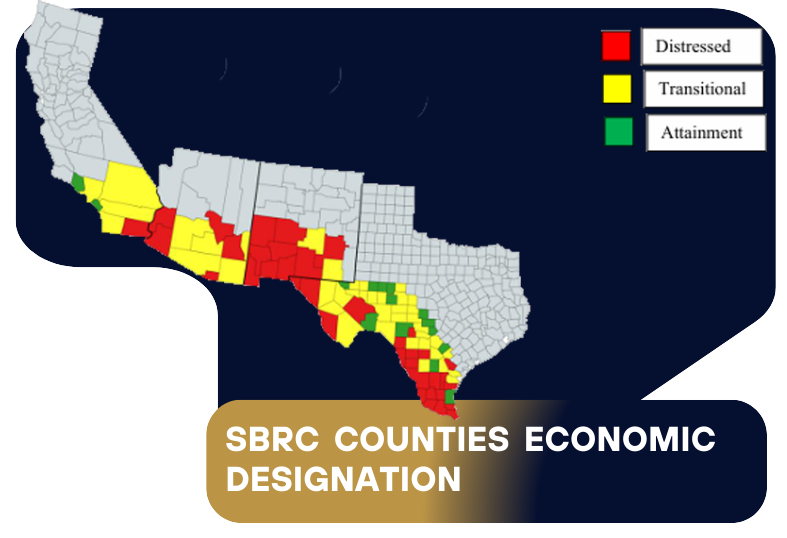
The SBRC is required to assess its region’s economic and demographic distress level annually and to classify counties’ distress levels. This map depicts the economic status of the SBRC’s counties using the Appalachian Regional Commission’s (ARC) national index-based economic classification system. The system compares each county to national averages of the three-year average unemployment rates, per capita market income, and poverty rates. Based on their comparative ranking, each county is classified within one of ARC’s five economic statuses designations-distressed, at risk, transitional, competitive, or attainment.
This framework was used to extract comparable data for the SBRC’s statutory service area, cross-referenced with the Census Bureau, American Community Survey 5-Year Estimates, Bureau of Economic Analysis, Local Area Personal Income. Outmigration was calculated using the percent change in total population from 2010 to the 2020 Census at the county levels. Because the SBRC’s authorizing statute only designates three classification levels– distressed, transitional, and attainment – the comparative economic classification range has been adjusted so that each one of the SBRC counties has been designated one of these three statuses. The designations are defined as follows.
The SBRC is required to assess its region’s economic and demographic distress level annually and to classify counties’ distress levels.
Counties that are the most severely and persistently economically distressed and underdeveloped and have high rates of poverty, unemployment, or outmigration. They rank in the worst 25% of the nation’s counties. The SBRC can fund up to 80 percent of the costs of a project in distressed counties. The SBRC must also allocate 50% of its total appropriations to projects in counties falling within this designation.
Counties that are economically distressed and underdeveloped or have recently suffered high rates of poverty, unemployment, or outmigration. Transitional counties rank between the worst 25% and the best 25% of the national counties. The SBRC can fund up to 50 percent of the costs of a project in transitional counties.


Counties not designated as distressed or transitional counties. Counties ranking in the top 25% of the national counties. The SBRC is not allowed to fund projects within an attainment county unless the project is within a designated ‘isolated area of distress.
State of Arizona
Counties classified as Distressed: Gila, Graham, La Paz, Santa Cruz, Yuma. (5)
Counties classified as Transitional: Cochise, Greenlee, Maricopa, Pima, Pinal (5)
Counties classified as Attainment: (0)
State of California
Counties classified as Distressed: Imperial (1)
Counties classified as Transitional: Los Angeles, Riverside, San Bernardino, San Diego, (4)
Counties classified as Attainment: Orange, Ventura. (2)
State of New Mexico
Counties classified as Distressed: Catron, Chaves, Cibola, Dona Ana, Grant, Hidalgo, Otero, Lea, Luna, Roosevelt, Sierra, Socorro. Torrance, Valencia (14)
Counties classified as Transitional: Bernalillo, Curry, De Baca, Eddy, Guadalupe, Lincoln (6)
Counties classified as Attainment: (0)
State of Texas
Counties classified as Distressed: Bee, Brook, Cameron, Dimmit, Duval, El Paso, Frio, Hidalgo, Hudspeth, Jim Hogg, Jim Wells, Kinney, Kleberg, Maverick, Pecos, Presidio, Real, Starr, Webb, Willacy, Zapata, & Zavala (22)
Counties classified as Transitional: Atascosa, Bandera, Bexar, Brewster, Coke, Concho, Crane, Crockett, Culberson, Ector, Edwards, Guadalupe, Jeff Davis, Karnes, Kenedy, Kerr, Kimble, La Salle, Live Oak, Medina, Menard, Nueces, Reagan, Reeves, San Patricio, Schleicher, Sutton, Tom Green, Upton, Uvalde, Val Verde, Ward, Wilson, Winkler (34)
Counties classified as Attainment: Crockett, Gillespie, Glasscock, Irion, Kendall, Loving, McMullen, Mason, Midland, Sterling, Terrell (11)

The Southwest Border Commission’s region encompasses 103 counties and approximately 36.3 million people across Arizona, California, New Mexico, and Texas.
Of the 103 counties in the SBRC’s service area, 46 are classified as economically distressed, 44 as transitional, and 13 as attainment counties.
Distressed counties account for approximately 11 percent of the region’s population, transitional counties account for 77 percent, and attainment counties comprise the remaining 12 percent.
The commission’s average poverty rate of 18% is significantly higher than the national average of 12.6%. It represents an estimated 5 million people living in poverty.
Get the latest information on news, events and more
The Southwest Border Regional Commission (SBRC) is a Federal-State partnership for economic and community development within the states of Arizona, California, New Mexico and Texas.
3655 Research Drive, Genesis Center-C
New Mexico State University
Las Cruces, NM 88003-8001